Well, this is a good question. We need powerful image/data registration techniques in order to be able to exploit all these multi-modal data sets. The following papers may help:
Friends! the next webinar for the same series will be on 6th June .Kindly register for another informative session. Thanks to MAKAUT and specially IT Dept.. I am also planning to invite them for IEM, next webinar series as an speaker.
I have missed the webinar on 2nd June,2020. It was my bad luck but I have attended the webinar of 6th June,2020 which was marvelous. Thanks. Regards, Swarup Kumar Hazra Choudhury, Registrar, AIEMD
Basically sensor data is single dimentional which will combines by IoT data when combined with geospatial analytics, business data, and operational data, the data reveals hidden patterns and relationships to predict more better results.
Regards, Dr. Prasenjit Kundu, Institute of Engineering & Management
IOT sensor data through cloud cab be used with special geo-spatial related information gathering to forecast geospatial analytics, business data, and operational data, the data reveals hidden patterns and relationships to predict in better way I hope. In our college lab we are try to do that.
Regards, Dr. Prasenjit Kundu, Institute of Engineering & Management
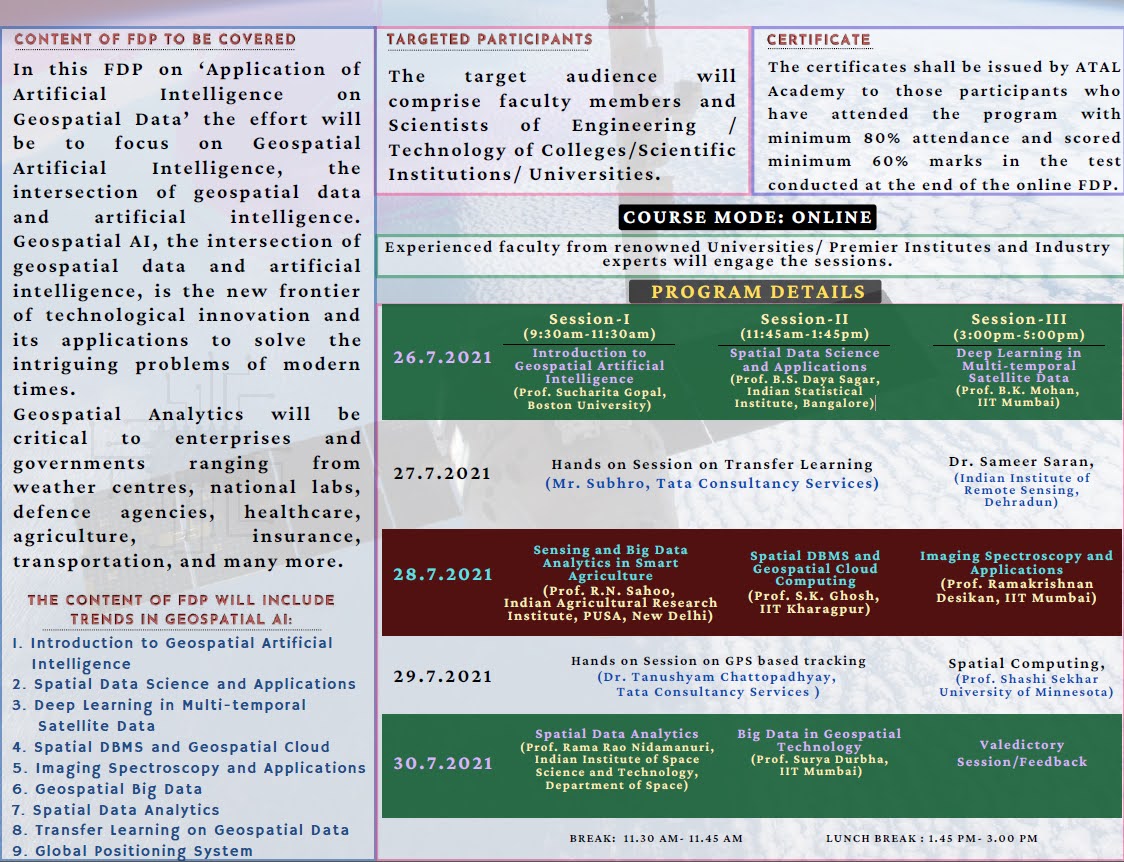
Geospatial analyticsis the application of geo visualization techniques and tools to analyze information on a spatial basis. The term geospatial refers to the use of GIS (Geographic Information Systems) to analyze data. The field covers a broad range of technologies and applications that provide users with several methods for visualizing their data.

where i can start the geospatial data analysis (any notes, any link)and are you using arc gis pro
ReplyDeleteHello, I am Akash Halder. How can blockchain be implemented with Geo-spatial domains?
ReplyDeleteThis comment has been removed by the author.
DeleteBlockchain can be implement with GEO-SPATIAL domains by first identify unsupervised clusters then apply block configuration on them.
DeleteThank you, sir
Deletecan i use this technology to finding earth ground water resouces?
ReplyDeleteYes, hyperspectral data can be used to map earth ground water resources. There are many publications on this:
Deletehttps://www.sciencedirect.com/search?qs=water%20resources%20hyperspectral
https://ieeexplore.ieee.org/search/searchresult.jsp?action=search&newsearch=true&matchBoolean=true&queryText=(((%22Full%20Text%20.AND.%20Metadata%22:water)%20AND%20%22Full%20Text%20.AND.%20Metadata%22:resources)%20AND%20%22Full%20Text%20.AND.%20Metadata%22:hyperspectral)
DeleteI can't download my Certificate...please anyone help me
ReplyDeleteplease give the certificate link
ReplyDeleteI participated the webinar session as well as assessment quiz, but do not receive certificate till now. Anyone please help me.
ReplyDeleteDear Sir plaza,
ReplyDeleteHow can we make comparable different sensor data(like landsat, sentinel , hyperspectral, Aviris )?
Well, this is a good question. We need powerful image/data registration techniques in order to be able to exploit all these multi-modal data sets. The following papers may help:
Deletehttps://ieeexplore.ieee.org/search/searchresult.jsp?action=search&matchBoolean=true&queryText=(((%22Full%20Text%20.AND.%20Metadata%22:Multi-Modal)%20AND%20%22Full%20Text%20.AND.%20Metadata%22:remote)%20AND%20%22Full%20Text%20.AND.%20Metadata%22:registration)&highlight=true&returnFacets=ALL&returnType=SEARCH&matchPubs=true&refinements=ContentType:Journals
Thank you sir
DeleteCertificates are available in the link https://bit.ly/2McsCEH. This link was displayed during the webinar session.
ReplyDeleteFriends! the next webinar for the same series will be on 6th June .Kindly register for another informative session. Thanks to MAKAUT and specially IT Dept.. I am also planning to invite them for IEM, next webinar series as an speaker.
ReplyDeleteIt is most important seminar to held in MACCOUT,that's really good and it is most important seminar to know everything in geographical resign In AI.
ReplyDeleteWONDERFUL PRESENTATION
ReplyDeleteThis comment has been removed by the author.
ReplyDeleteWell presented by prof jun li.
ReplyDeleteI have missed the webminar on 2nd june,2020. It was my bad luck but I have attended the webminar of 6th june which was marvelous.
ReplyDeleteI have missed the webinar on 2nd June,2020. It was my bad luck but I have attended the webinar of 6th June,2020 which was marvelous.
ReplyDeleteThanks.
Regards,
Swarup Kumar Hazra Choudhury,
Registrar, AIEMD
CERTIFICATE IS NOT SHOWING ON FOLDER RATHER FOLDER IS BLANK
ReplyDeletecan any one post the link for certificate download
Deleteplease?
Regards,
Dr. P.Kundu,IEM
This comment has been removed by a blog administrator.
DeletePlease share the certificate link
ReplyDeleteBasically sensor data is single dimentional which will combines by IoT data when combined with geospatial analytics, business data, and operational data, the data reveals hidden patterns and relationships to predict more better results.
ReplyDeleteRegards,
Dr. Prasenjit Kundu,
Institute of Engineering & Management
Very nice presentation
ReplyDeleteSir, i have submitted the quiz and get 4 out of 5 but i did not get the certificate. Pls look into this...
ReplyDeleteSir I have submitted the quiz and my score was 5/5 but my certificate has not been issued. Please do the needful.
ReplyDeleteITS WONDERFUL EXPERIENCE.
ReplyDeleteThanks.
Regards,
Swarup Kumar Hazra Choudhury,
Registrar, AIEMD
IOT sensor data through cloud cab be used with special geo-spatial related information gathering to forecast geospatial analytics, business data, and operational data, the data reveals hidden patterns and relationships to predict in better way I hope. In our college lab we are try to do that.
ReplyDeleteRegards,
Dr. Prasenjit Kundu,
Institute of Engineering & Management
Geospatial analyticsis the application of geo visualization techniques and tools to analyze information on a spatial basis. The term geospatial refers to the use of GIS (Geographic Information Systems) to analyze data. The field covers a broad range of technologies and applications that provide users with several methods for visualizing their data.
ReplyDelete